Revenue
Read your hotel revenue performance
Revenue Management brings property and portfolio KPIs into one view so teams can understand pace, mix, and performance over time.
Best for
General managers and revenue teams
Time
5 minutes to review
Outcome
A revenue view with the right property and date context
Before you start
- Revenue data is available for the selected property
- You know the date range or comparison you need
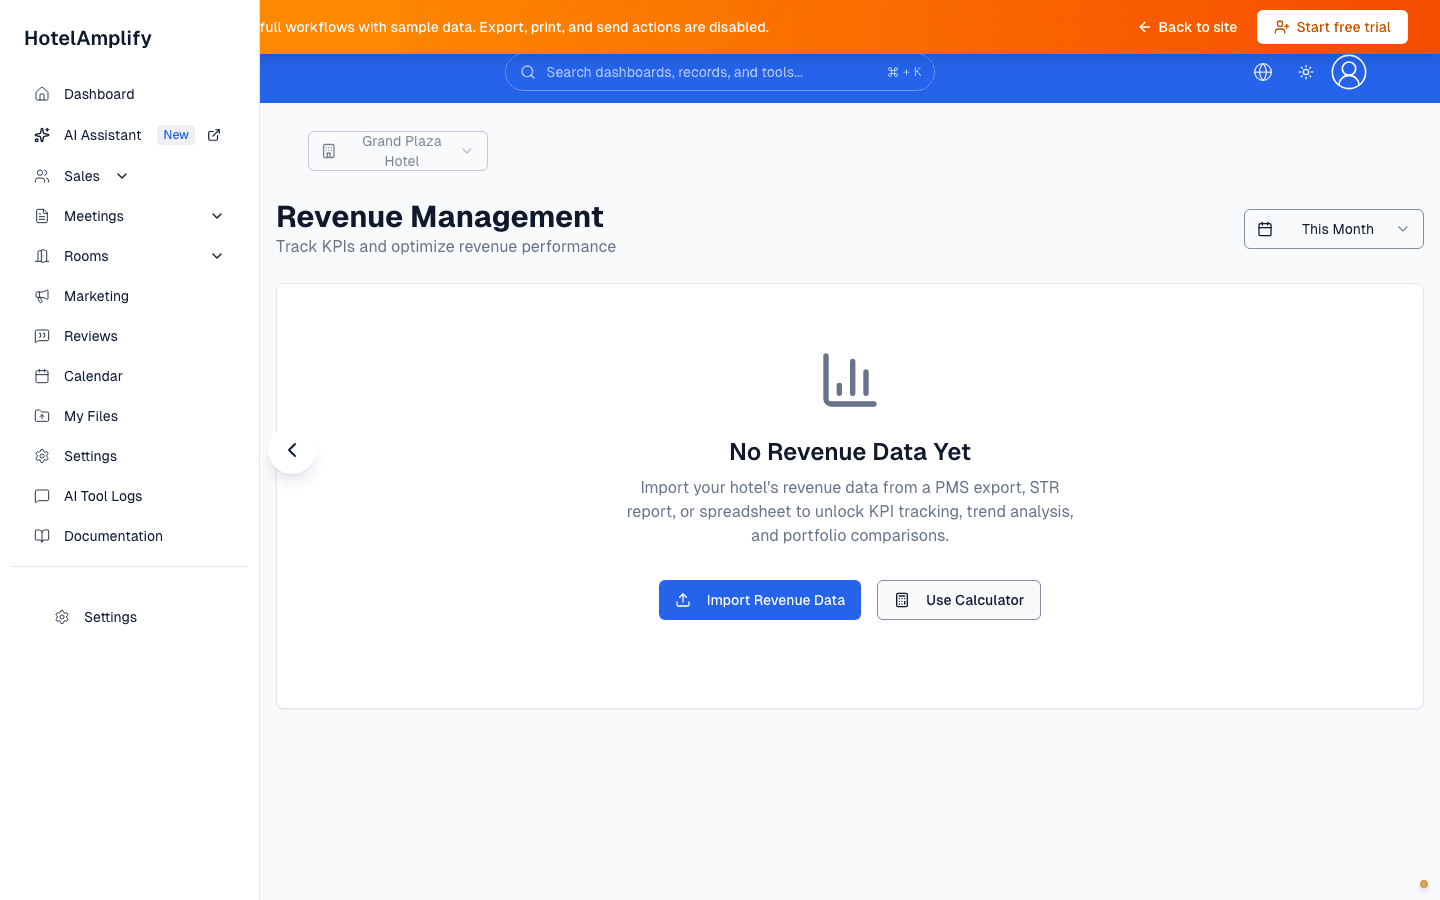
When the selected property has no revenue data yet, the page points you to Import Revenue Data or Use Calculator. KPI and comparison views appear after the required data is available.
Open in HotelAmplifyKey metrics
- RevPAR: revenue per available room.
- ADR: average daily rate for rooms sold.
- Occupancy: the occupied share of available rooms.
- Total Revenue: the revenue total for the selected period and property context.
Explore the revenue views
- Overview: review headline KPIs, revenue mix, and room performance.
- Trends: inspect daily room revenue over time.
- Budget vs Actual: compare performance against monthly budgets when budgets are configured.
- Property Comparison: compare properties when portfolio data is available.
Review revenue performance
Choose the property context
Open Dashboard → Revenue and select a property or portfolio context before reading the numbers.Set the period
Choose a date range such as This Month, Last Month, This Quarter, or This Year.Read the headline numbers
Start with RevPAR, ADR, Occupancy, and Total Revenue, then open Revenue Mix or Room Performance for more detail.Move to the question you need to answer
Use Trends for pace over time, Budget vs Actual for plan variance, or Property Comparison for a portfolio view. Forecasting is not yet a dashboard workflow.
You'll know it's done when
You have the right property, date range, and view selected for the question you are trying to answer.
When no data appears
Import revenue data from a PMS export, STR report, or spreadsheet. The Revenue page needs a selected property and data for the chosen date range before it can show trends or comparisons. If no property is available, add one in Settings first.